Property energy intelligence

Make every commercial building a better energy decision.

Plendor analyses buildings and portfolios, then models the energy ecosystem that makes sense for each one: solar, storage, heat, charging, building fabric and financial modelling.

Eco
1 · The building
Interactive: switch the building type or add a measure
2 · The ecosystem2 selected
Each change re-models the whole system: sizes and capital re-optimise together.
3 · Modelled outcome
Capital
Saving / yr
Payback
A day on this buildingevening peak −59 kW
0006121824
grid importsolar directbattery outbattery chargeexportsite demandstate of charge (% of pack)
Met on site25% modelled
Carbon−61 t/yr modelled
EPC asset ratingED–C · screening
A
B
C
D
E
F
G
Enow
D–Cscreening
Lens

Find the buildings worth building on.

Plendor screens commercial and industrial buildings at scale, then ranks them on the evidence it holds: roof, demand, EPC, grid and commercial context. Scroll to watch a flat schedule resolve into a priority order.

Unsorted schedule
See how screening works
Loading the estate
priorityreviewscreenedopportunity score /100
How Eco works

The question isn’t which measure. It’s which combination.

Eco compares technology combinations against the building’s physical, operational and financial context. It answers not only “Can we install solar?” but “What combination of energy assets creates the strongest overall outcome?”

01

Understand the building

Roof, irradiance, demand profile, EPC, tariffs, grid and site constraints, each with a confidence level attached.

building-profile · hourly view
Average weekday demand
184kW peak · 06:00–18:00 shape
0006121824
site demandmodelled PVmetered half-hourly · drawn hourly
Half-hourly consumption0.90 GWh/yrMetered
Roof geometry3,150 m² usableSurveyed
EPC asset ratingD · 88On record
Import tariff shapeday/nightAssumed
02

Build scenarios

Solar, battery, heat pump, EV charging and fabric measures, combined rather than assessed one at a time, each mix carrying its own financial model.

scenario-builder · measure mix
Rooftop solar
420 kWp
Battery storage
250 kWh
Air-source heat pump
180 kW
EV charging
8 bays · 11 kW
LED relight
whole site
Fabric measures
roof + glazing
Mix capital required£675k
SolarBatteryHeat pumpLED
03

Compare outcomes

Capital required, savings, payback, return, energy impact, EPC and ESG, compared side by side so the trade-offs between them stay visible.

scenario-compare · 25-yr NPV
Owner CapEx£752k
payback 6.7 yIRR 16.4%balance-sheet funded
Asset Finance£716k
payback 8.4 yIRR 27.9%£0 upfront · repaid over 7 yrs, cash-positive yr 8
PPA£181k
payback 8.5 yIRR 12.7%array PPA-funded · £286k owner scope: stores, heat, LED
04

Test the sustainability outcome

What the measures do to carbon, to the asset rating and to the regulatory position, produced by the same run as the financial appraisal rather than as a separate exercise.

sustainability · carbon and rating
Site carbon
−58%
212 → 89 tCO₂e/yr incl. gas
Asset rating
D → B–A
score 88 → 15–37 · screening range
Grid import
−24%
0.9 → 0.68 GWh/yr
Where the carbon goes
Heat pump (gas off)75 t
Rooftop solar40 t
LED and controls8 t
Band B, ahead of the 2031 minimum proposed for rented buildings over 1,000 m². Carbon is counted on both carriers (grid 0.131, gas 0.183 kgCO₂e/kWh, DESNZ 2026), which is why site carbon falls further than grid import: the heat pump ends the gas burn while adding electricity.
05

Choose a pathway

A recommended configuration, the order it should happen in, and the next validation step.

dispatch · proposal case
Modelled dispatch · bright summer weekday
evening peak −64 kW
the ledger’s source day; dull-day overnight arbitrage runs nightly, not drawn here
grid importPV directbattery outbattery chargeexporttotal load
Solar and LED first, stores and heat follow£423k then £252k
Battery and heat pump sized on a year of metered data under the array.
Plendor recommends
building-profile · hourly view
Average weekday demand
184kW peak · 06:00–18:00 shape
0006121824
site demandmodelled PVmetered half-hourly · drawn hourly
Half-hourly consumption0.90 GWh/yrMetered
Roof geometry3,150 m² usableSurveyed
EPC asset ratingD · 88On record
Import tariff shapeday/nightAssumed
Understand the building
Decision stories

Different energy questions. One decision-ready model.

Whether you own buildings, provide energy technology, finance projects or manage a portfolio, Plendor helps you understand what is worth doing before committing capital, equipment or time.

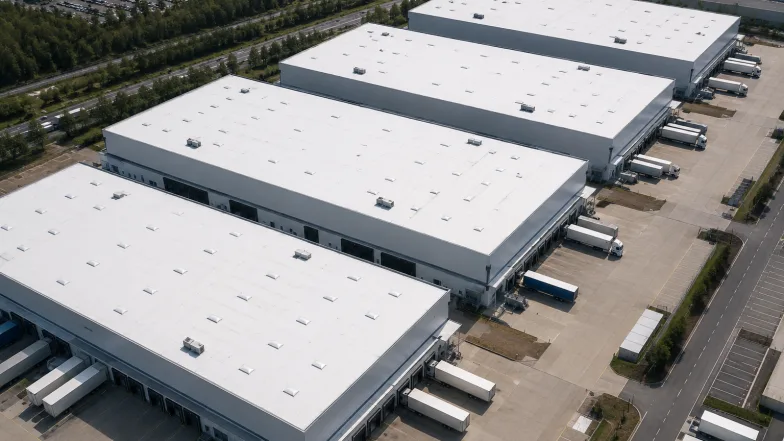
Distribution units with empty flat roofs on a logistics park
PPA providers

Which buildings are ready for a PPA?

Inputs
Portfolio list, roof geometry, irradiance, demand proxies, grid context.
Output
Prioritised pipeline with building potential, demand context and project economics.
Find PPA opportunities
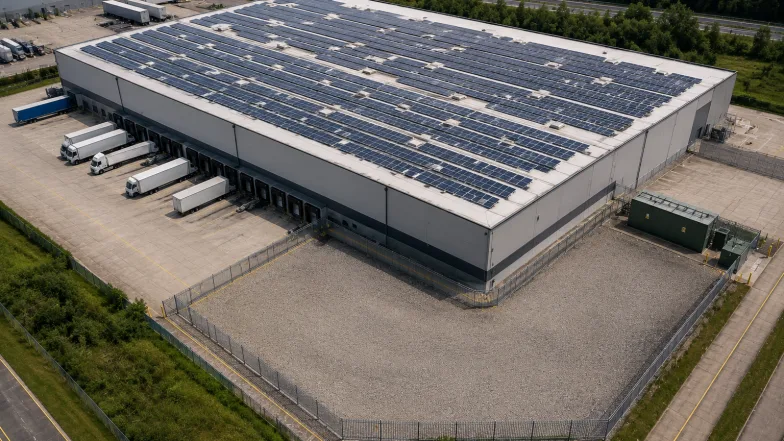
Warehouse under a full rooftop solar array, with an empty fenced compound beside the packaged substation
Existing solar portfolios

Where would batteries actually pay back?

Inputs
Existing array sizes, export behaviour, tariffs, load shape.
Output
Ranked retrofit view with suitable sites, storage scenarios, savings and payback.
Model my portfolio
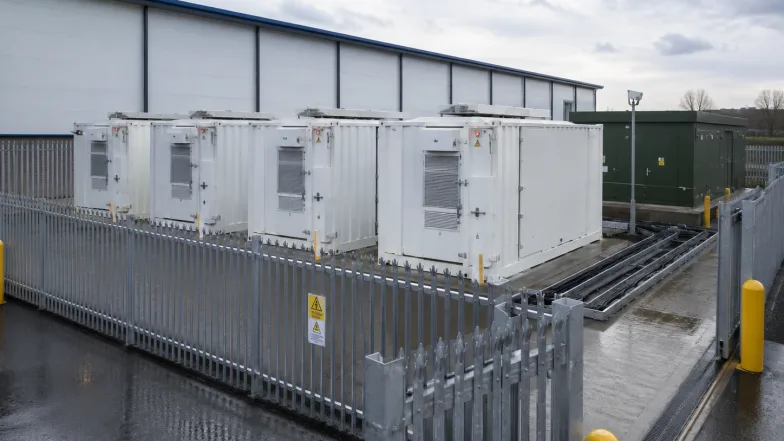
Containerised battery units behind palisade fencing beside a substation and an industrial unit
Battery and technology providers

What size battery should we quote for this site?

Inputs
Your customer’s half-hourly consumption, their tariff, any generation on site, and the connection limit.
Output
A capacity to quote, what it earns a year, the peak it takes off, and the payback at every size.
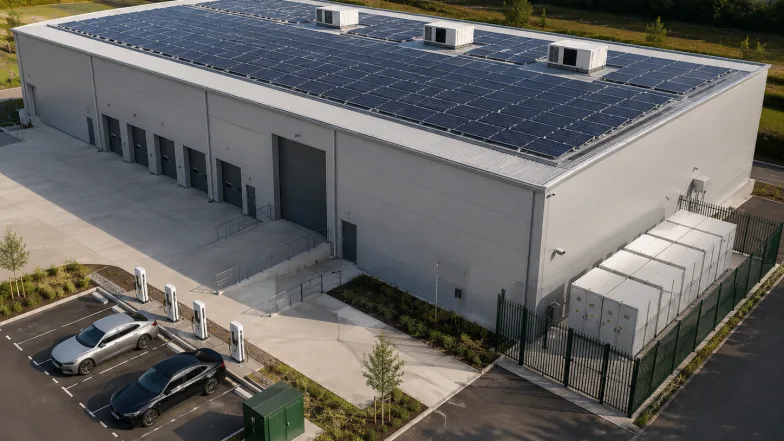
Size a battery for a site
Industrial unit carrying rooftop solar, roof plant, a battery compound and EV chargers together
Building owners

What is the best energy ecosystem for this building?

Inputs
Building fabric, roof, demand, EPC, tariffs, available capital.
Output
Technology comparison balancing investment, savings, return, EPC and ESG.
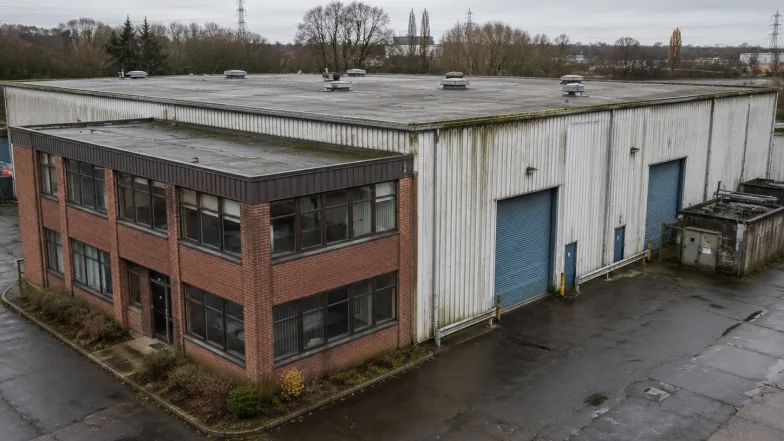
Model my building
Ageing industrial unit with weathered metal cladding, a dated brick office frontage and a bare roof
Landlords

What is the most practical route to improve this asset?

Inputs
EPC certificate, lease events, fabric condition, measure costs.
Output
Phased improvement pathway showing measures, costs, EPC effect and priorities.
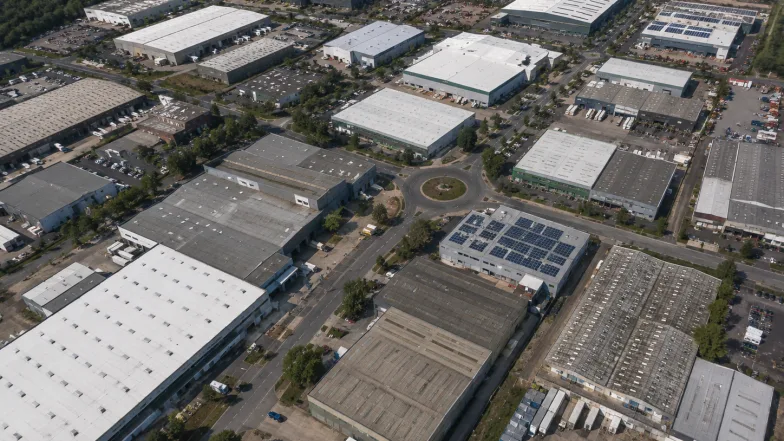
Plan an improvement pathway
Aerial view across an industrial estate of many roofs of differing age, condition and solar coverage
Investors / portfolio managers

Which buildings should we invest in first?

Inputs
Estate schedule, building-level signals, capital envelope.
Output
Ranked portfolio plan based on building-level evidence and scenario modelling.
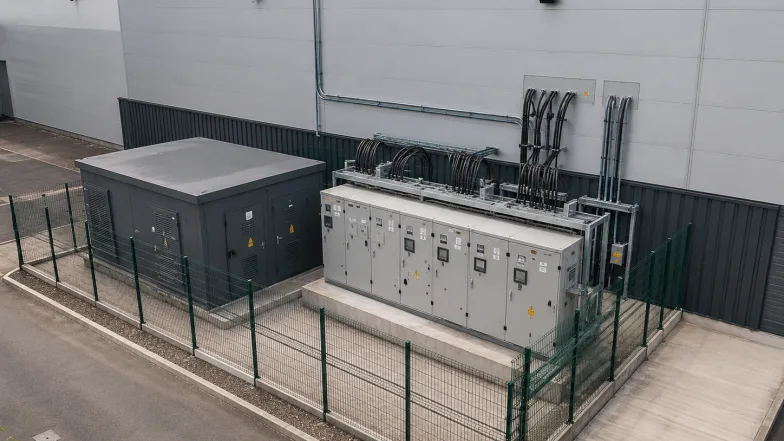
Review my estate
Substation kiosk and switchgear cabinets behind mesh fencing at a building's supply intake
Energy buyers

Would a different supply contract change the plan?

Inputs
Half-hourly consumption, offer rate structures, standing charges, contract terms.
Output
Offer comparison showing the modelled bill and what each contract does to the case for storage.
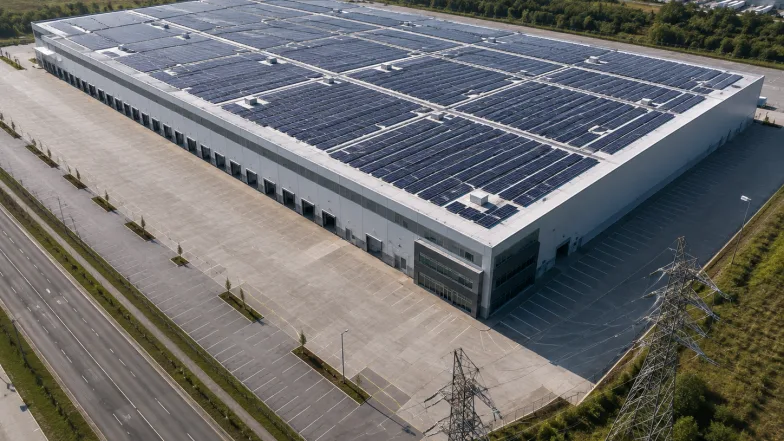
Compare supply offers
Fully covered solar roof above an empty yard, with transmission pylons crossing the site boundary
Sites with surplus generation

Where should the surplus go, and who should buy it?

Inputs
Half-hourly generation, export offers and their windows, storage headroom, connection limit.
Output
Export position showing what the surplus earns under each offer and how much is worth storing.
Value my export
Drag to explore

Have a building, portfolio or energy question?

Tell us what you are trying to decide. A single building, a portfolio, or a delivery, technology or finance partnership. We will show you how Plendor can screen the opportunity or model the ecosystem behind it.